| 类别 | SUVmax | TBR | TLR | ||||||||
|---|---|---|---|---|---|---|---|---|---|---|---|
| FDG | FAPI | P值 | FDG | FAPI | P值 | FDG | FAPI | P值 | |||
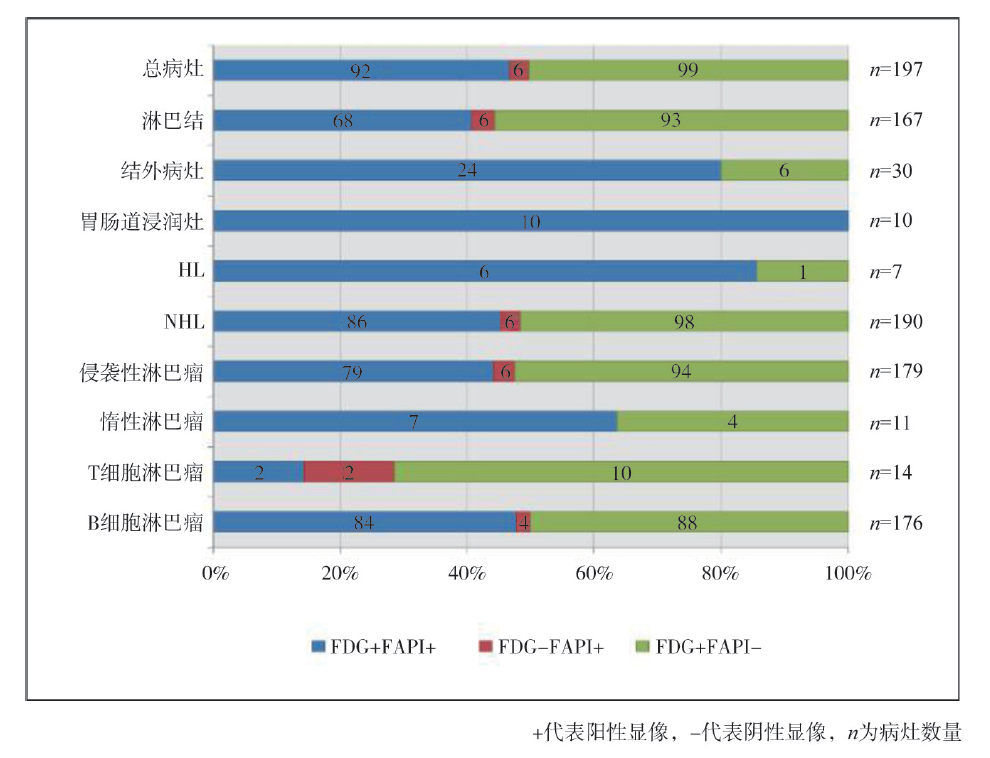
| 总病灶 | 14.40 (8.05,21.53) | 6.50 (4.80,8.97) | <0.001 | 13.33 (8.66,21.94) | 3.43 (2.54,5.58) | <0.001 | 5.23 (2.91,9.03) | 5.23 (4.00,8.85) | 0.465 | ||
| 淋巴结 | 15.00 (10.30,24.30) | 7.10 4.70,9.00) | 0.001 | 16.67 (9.23,24.30) | 3.58 (2.47,5.50) | 0.001 | 7.90±5.50 | 6.97±4.46 | 0.502* | ||
| 结外病灶 | 14.56±8.02 | 7.34±4.21 | 0.001* | 12.14 (8.63,19.10) | 3.20 (3.00,5.70) | <0.001 | 5.06 (2.85,8.85) | 5.27 (4.36,8.30) | 0.136 | ||
| 胃肠道病灶 | 13.59±5.73 | 8.41±4.95 | 0.022* | 5.36±3.03 | 4.57±3.12 | 0.477* | 5.06 (3.09,8.85) | 6.78 (5.00,8.90) | 0.051 | ||
| HL | 12.27±2.75 | 6.50±1.18 | 0.119* | 11.57±2.83 | 5.07±1.59 | 0.126* | 5.93±0.64 | 6.93±1.11 | 0.132* | ||
| NHL | 13.80 (8.20,21.45) | 6.60 (4.80,8.95) | <0.001 | 12.88 (8.70,21.76) | 3.30 (2.55,5.55) | <0.001 | 6.46±4.31 | 7.01±4.31 | 0.550* | ||
| 侵袭性 淋巴瘤 | 15.60 (8.20,22.10) | 6.60 (4.85,8.95) | <0.001 | 12.51 (8.74,20.26) | 3.29 (2.55,5.53) | <0.001 | 6.74±4.42 | 6.64±3.81 | 0.909* | ||
| 惰性 淋巴瘤 | 10.23±3.82 | 10.87±7.39 | 0.812* | 21.40 (13.52,24.50) | 5.12 (3.82,8.18) | 0.109 | 3.83±1.64 | 10.41±7.97 | 0.219* | ||
| T细胞 淋巴瘤 | 18.20±11.58 | 6.54±3.53 | 0.035* | 12.00 (9.23,18.60) | 3.05 (2.47,3.20) | 0.043 | 7.56±6.06 | 6.24±4.53 | 0.200* | ||
| B细胞 淋巴瘤 | 12.25 (8.05,21.53) | 7.00 (4.90,8.97) | <0.001 | 13.33 (8.66,21.94) | 3.65 (2.68,5.58) | <0.001 | 6.25±4.01 | 7.16±4.35 | 0.400* | ||